Dry Conditions Cause Electricity Imports to Exceed Exports in February 2024
May 21, 2024
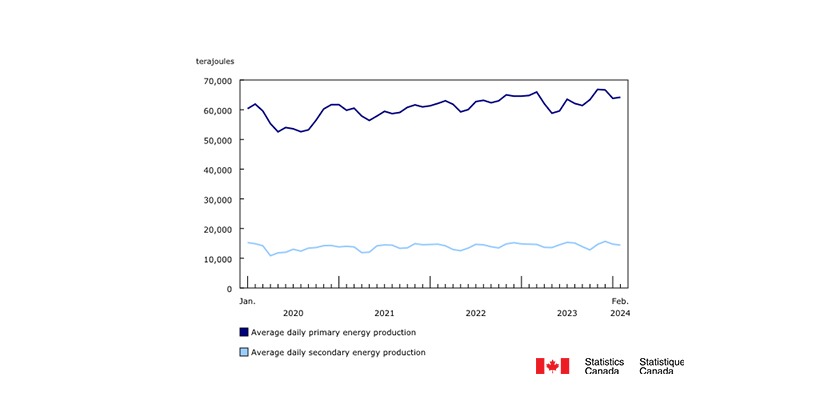
On a year-over-year basis, primary energy production increased 2.6% in February to 1.9 million terajoules, while secondary energy increased 1.3% to 0.4 million terajoules.
As 2024 is a leap year, February’s data contain a 29th calendar day. This additional day should be taken into consideration when looking at year-over-year comparisons with February 2023 data.
In terms of average daily production, both primary (-0.9%) and secondary (-2.2%) energy pulled back in February.
Dry conditions cause electricity imports to exceed exports
Prolonged dry conditions across much of Canada reduced hydroelectric generation over the past year, leading to lower export volumes and increased imports to compensate.
Total electricity generated in Canada fell 4.9% year over year to 53.6 million megawatt-hours (MWh) in February. Average daily generation was 8.2% lower in February compared with the same month the previous year. A 12.5% year-over-year drop in hydroelectric generation led the overall decline in February.
Imports of electricity from the United States reached 2.7 million MWh in February, edging out exports, which stood at 2.6 million MWh. This marked the first time that electricity imports have exceeded exports since this data series was redesigned in 2016. This was also the highest level of imports and the lowest level of exports since the redesign.
Canadian imports and exports of electricity

In February 2024, imports were 124.1% higher than their average February value recorded from 2016 to 2023 (1.2 million MWh), while exports were 44.8% below their average February level for the same period (4.8 million MWh).
Quebec (-61.6%) contributed the most to the year-over-year decrease in exports in February 2024, followed by Ontario (-29.5%) and New Brunswick (-49.9%). Imports to British Columbia rose 46.6% year over year, accounting for 71.7% of total imports. Imports to drought-stricken Manitoba also contributed to the overall increase.
Crude oil production up for fifth consecutive month
Production of crude oil and equivalent products rose 6.5% to 23.5 million cubic metres in February. This was the fifth consecutive year-over-year increase, as producers in Western Canada have been ramping up output in preparation for the opening of the Trans Mountain pipeline expansion.
Canadian production of crude oil and equivalents

The increase in February was driven by oil sands extraction, which rose 6.7% to 15.4 million cubic metres year over year (+3.0% at the average daily level). Crude bitumen production, up 8.5% to 9.4 million cubic metres, was the main contributor to the increase in February. Bitumen production slightly increased from January, although it was not back up to the record-high average daily production volumes observed at the end of 2023. Production of synthetic crude also contributed to the overall gain, up 3.9% from February 2023 to 6.0 million cubic metres in February 2024.
Production of finished petroleum products increases in February
Production of finished petroleum products climbed 4.5% year over year in February to 9.7 million cubic metres. Meanwhile, average daily production edged up 0.9% compared with February 2023 to 0.3 million cubic metres.
Production and consumption of finished petroleum products

Production and industrial consumption of natural gas rise
Production of marketable natural gas rose 6.6% year over year to 650.1 million gigajoules in February 2024. Average daily production of marketable natural gas rose 2.9% compared with February 2023 to 22.4 million gigajoules in February 2024.
Total monthly deliveries of natural gas to Canadian consumers rose 3.0% year over year to 497.4 million gigajoules in February. Meanwhile, average daily deliveries were down 0.6% to 17.2 million gigajoules.
The Canadian industrial sector received 13.8% more natural gas in February compared with one year earlier, the 12th consecutive monthly increase. The industrial sectors in Ontario (+43.1%) and Alberta (+9.2%) were primarily responsible for the rise, which corresponded to an increase in electricity generation from combustible fuels, including natural gas.